Using Market Explorer
To use Market Explorer:
From the page, click .
Result: The Geographic and Business filter functions display.
The and filters are used to limit the results displayed on the map.
Every search is bounded by the viewable map area. Filters are dynamic. As results change, zoom your map to the location you want to view.
The number of results returned is limited to a system-tunable upper limit of 5000 (Super User).
The application remembers the search settings for the current user as a starting point for the next instance.
Click your search criteria, either or .
To search using geographic filters, see Searching by Geographic Filters
To search using business filters, see Searching by Business Filters
Note
The data that displays for Tenant Results and Building Results depends on if your user group has Advanced Market Explorer permissions enabled.
Upon purchase of the Market Explorer module within The Connected World, a Connectbase Administrator issues you a login, password, and permissions. Market Explorer is enabled at the company (instance) level.
To login to The Connected World:
Start your web browser, enter the following URL into the location/address field: https://cw.connectbase.com/#/login, then press Enter.
Result: The Connectbase Login dialog box displays.
Enter your login credentials and click .
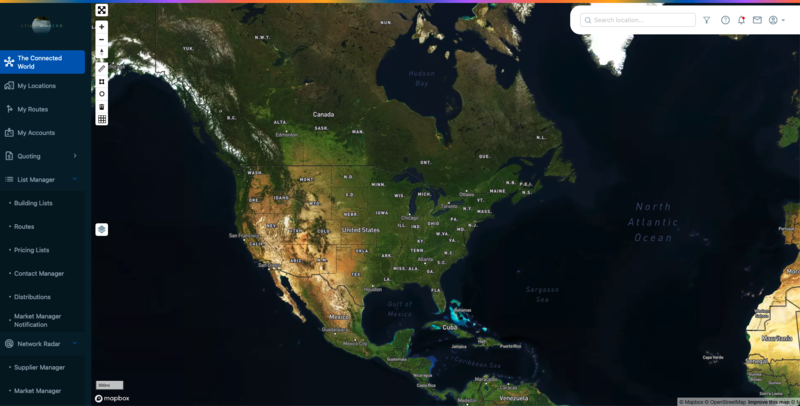
Result: The Connected World map displays as the default screen.
Note
If you forget your password, click ? Enter your email address and press . A link is sent to your email enabling you to reset your password.
To access Market Explorer, click the
 icon that is located on top right of the map page.
Result: The Map Filters page displays. Select the tab to start a new search.
Select the required categories and fill in the required information as desired.
Click the button to launch Market Explorer grid.
Advanced Market Explorer enables you to view additional building and tenant information on the TCW map. This feature extends Market Explorer functionality while providing capability to configure additional columns that a user can view.
Note
You can initiate a new search by clicking on the filter button next to address search bar and entering building categories, geography filters or route proximity under the "Markets" tab to launch Market Explorer. For more information refer to Accessing Market Explorer.
The grid shows the default market explorer columns. If Advanced Market Explorer is enabled and you have configured additional columns to display or have changed the order of the selected columns, the selected columns and order displays here.To select additional columns and/or change the arrangement of the columns, see Manage Advanced Market Explorer in Admin section of TCW.
Note
If you use Advanced Market Explorer with Export Privileges enabled and click on Markets tab, you can extract the latest additional attributes from locations and tenants data and load it directly to "My Locations" and "My Accounts", as a user.
To search by geographic data:
From the Market Explorer tab, click Geographic.
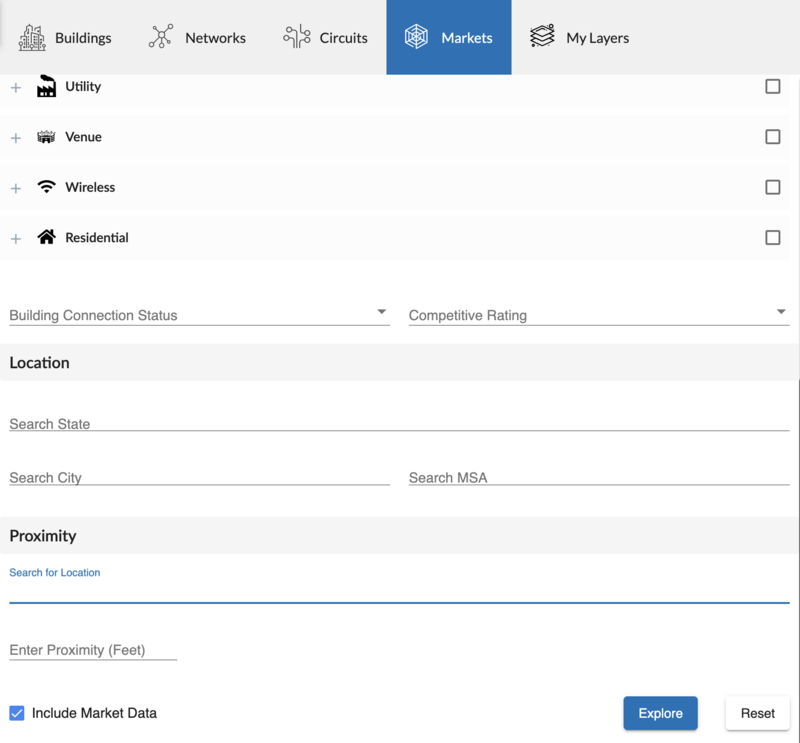
Result: The Geographic Filters screen displays.
Select/enter geographic filter preferences to limit the results you wish to view on the map. Refer to the Geographic Filter Attributes table for more details.
Click the down arrow to the right of any field attribute to view the filtering options available for that attribute.
Use the grey slide bar to the right of the map filters to scroll through the filter attributes.
When you enter/select search criteria, the system remembers your filters and displays those the next time you open Market Explorer. To define new search criteria, click , located at the top right of the Filter ribbon.
Geographic Filter Attributes
Filter/Attribute
Description
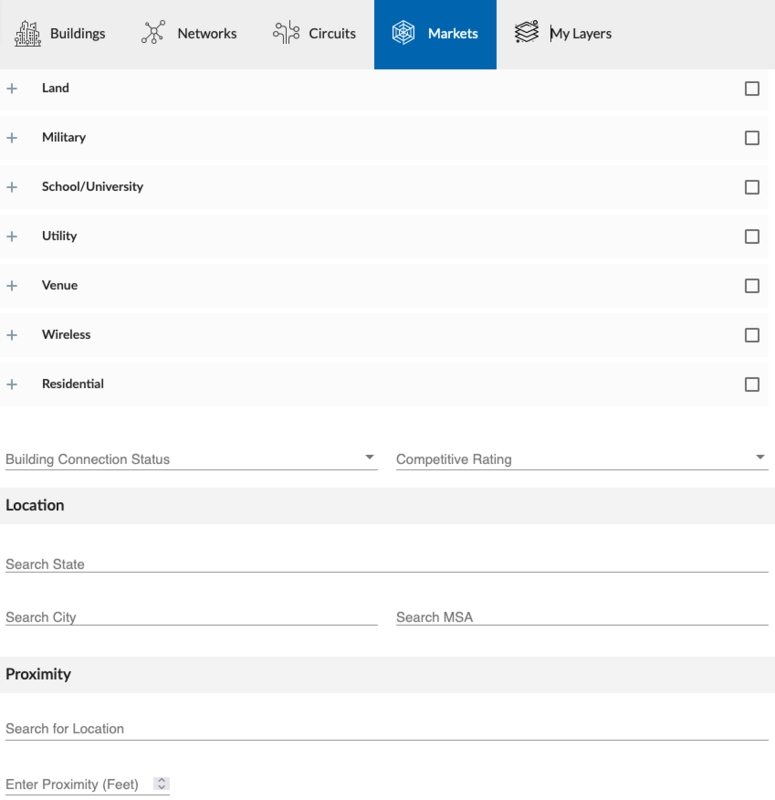
Categories
Click the check boxes for the location types you want included in your search results. Alternatively, you can click “Select All” to include all location types in your search.
The main options include:
Airport
Commercial Building
Data Center
Government
Health Care
Land
Military
School/University
Utility
Venue
Wireless
Residential
To further refine your search, click the plus sign ( + ) to the left of any of the main options to view a sub listing of location types. For example, if you click the + sign to the left of Venue, a sub list of venue types displays, such as Amusement Park, Arena, Casino, etc.
To clear selections, either click the checkbox again to deselect a location or to clear all, click CLEAR ALL at the bottom of the listing.
Building Connection Status
Click the specific connection status attributes that you want to include in your search results or click Check All to include all types. Options include:
OnNet – In the carrier’s network and can be readily activated.
On Net-Limited Access - Location is OnNet but requires some work for activation
Near Net – Same as OffNet, except the location is within closer proximity to the carrier network, potentially indicating easier provisioning and shorter time frames.
OffNet – Location that is not immediately connected to the carrier’s network; however, may be accessed through a third party.
Prospect – When you add tenants to an account via tagging and click the Include Market Data attribute, if that building is not already in your building footprint it is added to My Buildings with a Connection Status and Network Status of Prospect. These locations also display on the map with a red target icon to indicate Prospect status.
Competitive Rating
Competitive Ratings data helps you to better understand the competitive landscape and more effectively price services.
If subscribed to Competitive Ratings data, click the specific competitive rating status attributes that you want to include in your search results or click Check All to include all options in the query.
Options include:
Green – There is no other competitive fiber provider at this location other than the customer’s own network, the LEC or the cableco.
Yellow – A single competitive fiber provider is present at this location.
Red – Two or more competitive fiber providers are present, in addition to the LEC or cableco, at this location
Location
Search State
Type the name of the state(s) to be included in the search results. As you begin to type the name of the state, auto selections display.
Search City
Type the name of the city or cities to be included in the search results. As you begin to type the name, auto selections display.
Search MSA
If you wish to limit your query to a specific metropolitan statistical area, type the area into the MSA field.
MSA typically refers to an extended metropolitan geographic area within a highly dense commercial population, such as Washington, Baltimore, Arlington.
Proximity
Search for Location
Type the street address for the location. The list auto populates based on what you are typing. Select the location from the list.
Enter Proximity (feet)
This attribute enables you refine your search results to show only those buildings that fall within the proximity (radius in feet) of the address you specify.
Select Route
Select the route from the drop-down list.
Include Market Data
Include Market Data
Click the check box to include market data in your search results. This field displays only if you have an active subscription to Market data.
After selecting your filter preferences, click .
Results:
The response is limited to the displayed map boundary.
When the search completes, the results window slides up from the bottom of the screen.
Use the
 and
and  arrows to open or close the results window.
To add the result records to “My Accounts”, see Tagging Records.
To export records and download them to a .CSV file:
To export select records, click the checkbox to the left of the records you want to export, then click .
To export all records to a .CSV file, click .
Note
In exported CSV file, location types and sub-types display in alphabetical orders for consistency.
To search by business:
From the Market Explorer tab, click .
Result: The Business Filters screen displays.
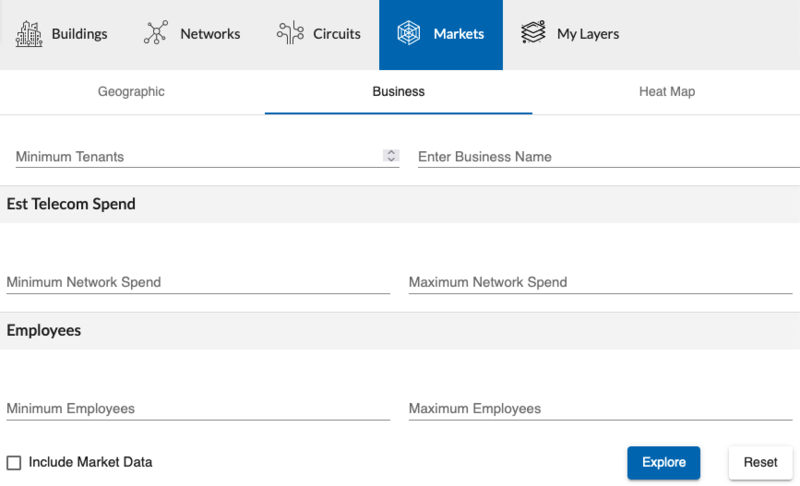
Use the Business filters to limit the tenant results you wish to view. Refer to the Business Filter Attributes table for more details.
Optionally, enter the values for Minimum and Maximum Est. Telecom Spend and Minimum and Maximum Employees. The default for these fields is empty, which will not limit the results from the query to the database along these dimensions.
All searches are bounded by the viewable area on the map.
Business Filter Attributes
Filter/Attribute
Description
Minimum Tenants
Default zero to max. Type the number of minimum tenants you want returned in the response
Est Telecom (Telco) Spend
Type the minimum network spend and the maximum network spend range into their respective fields, beginning at 0 up to 106M Max.
The Est. Telco Spend is indicated at the location level. It is the estimated cost for telecommunications services at a specific location of a company. For example, $600.00 for Taco Bell at 100 Main St.
In contrast, Entity Telco Spend (seen in My Accounts) is at the entity level. It is the telecommunications spending for a specific entity, such as an overall company. For example, $580,530 for all Taco Bell branches globally.
Note
The Est Telco Spend is a Connectbase proprietary calculation that uses an in-house algorithm for monthly network spend. The factors that influence that calculation for spend are employee count, number of locations, industry, and the network competition at that site.
Employees
Type the minimum number of employees and the maximum number of employees, number range, into their respective fields, beginning at 0 up to 3M Max.
Enter Business Name
Type the name of the business to be searched on
Include Market Data
Click the check box to include market data in your search. This field displays only if you have an active subscription to Market data.
After selecting your filter preferences, click
Results:
The system produces a result set that is reflected on the “sample” screen below. The output shows all Tenants that match the search criteria you specify.
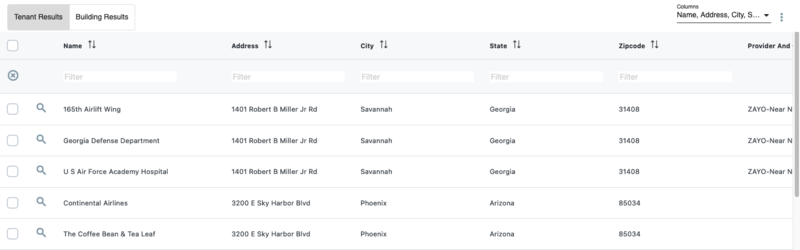
Actions:
Records are selectable, scrollable, and searchable. Records can be filtered, and columns can be added.
The down arrow at the top, middle of the results table enables you to slide the results window down to view additional records.
The up arrow at the top, middle of the results table to enables you to view the tenant results in full screen view.
The Results table, when minimized, will not automatically reopen if the map moves. It will re-open to the default height when the user specifically re-opens it.
The vertical ellipses
 drop-down menu to the right of the Results table enables you to tag/add selected records or all records to “My Accounts” (see Tagging Records).
Where applicable, clicking on a tenant name launches the Enterprise Profiler.
Where enabled, the Network Intelligence icon before the name of a record
 enables you to access the Network Intelligence popup for the selected tenant record. For example:
From the results of your search, you can tag selected records, or all records, and then name and save them to your “My Accounts” database. For more information about “My Accounts”, see About My Accounts.
To tag records:
Click the checkbox beside each of the records you want to tag, or to tag all records, click .
Click the vertical ellipses
drop-down menu in the upper right-hand corner of the results screen.From the drop-down menu, select either or .
Result: The Enter New Tag Name for Selected Results dialog box displays.
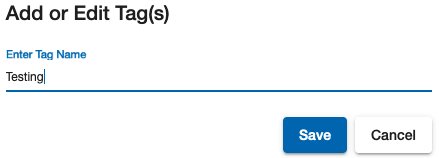
Type the name that you want to associate with this grouping of tagged records.
A single tenant location can have more than one tag name.
Tag Names can be reused to add more locations to a tag.
Result: The is added to all selected locations for the current user.
Click .
To see potential network selling opportunities, view the heat map for a high-level view into the network demand. The Heat Map tracks monthly network spending by city level using the Est Telco Spend. The Est Telco Spend is a Connectbase proprietary calculation that uses an in-house algorithm for monthly network spend. The factors that influence that calculation for spend are employee count, number of locations, industry, and the network competition at that site.
Note
You can select multiple cities to display in the map.
To use the heat map:
Navigate to tab.
Enable the check box.
Enter the name of a city and click .
Result: The map displays the heat map of the city.
The Market Grid tool can be used to gain market insights of your potential markets and competitiveness across your entire company footprint. Subscribed users can see a visual representation of their market demand based on their OnNet building footprint in The Connected World, summarized with a “Grid Fit Score” to indicate potential return on investment and to aid in market planning decisions.
Note
The Market Grid is an instance level enablement that must be set by an internal Connectbase Administrator. If you need assistance, please contact your Customer Success Manager.
To use the Market Grid:
Click tab. from the navigation sidebar.
Click
from the map page.Navigate to tab
Result: Default view is set to the Grid Fit Score. To view other data, select the drop-down and choose an option.
Note
If the Grid function is not displayed within the Markets tab, your instance may not be enabled for this feature. If your instance is not enabled, contact Connectbase Customer Support for the appropriate user permissions.
The Grid is color coded by the Grid fit score; the higher the score the denser the blue appears in color. To see the following data, hover over the individual grid squares:
Data Type | Description |
|---|---|
City | City where the grid is located. |
Total number of locations | Number of locations including both non-residential and residential within the grid. |
Average Telecom spend | The average network spending in the grid based on non-residential locations. |
Unique provider count | Number of network providers in the grid. |
Top market share network providers | The top three market share providers in the grid. |
Provider market share | How much of the provider location is OnNet in the instance versus the total number of locations. |
Number of OnNet locations | Number of locations that are OnNet. |
Average Build Distance (FT) | The average distance of the number of locations you do not service within the grid. Measured in feet. |
Grid Fit Score | A score that measures the return on investment and is based on how much of the addressable market you can connect to divided by average build distance. The higher the score the higher the return on investment. |